Cell Culture Observation SystemBioStation CT
iPS/ES cell research use
High-resolution imaging
It is possible to track the clonal colony derived from a single cell by magnifying a desired area of the high-resolution whole-vessel image.
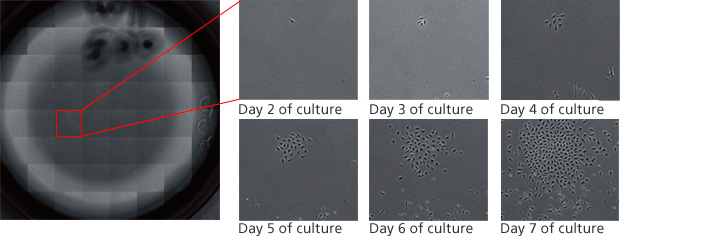
Division process of human hepatic stem cells
Vessel: 6-well plate
Magnification: 2x
Culture period: 1 week
Imaging interval: 2 hours
Courtesy of Dr. Yun-Wen Zheng, Yokohama City University
Directed reprogramming
Mouse skin fibroblasts inserted with two reprogramming factors (c-Myc, Klf4) and a chondrogenic transcription factor (Sox9) by gene transfer were observed over time. Generation of chondrocyte-like cells directly from skin cells was successfully observed with the expression of a chondrocyte-specific marker, reporter gene of type XI collagen. This research was published in the Journal of Clinical Investigation, 2011;121(2):640—657.
The whole area of the 6-well plate was observed at 2x magnification every second day.
- Image of GFP, reporter of type XI collagen gene, merged with a phase contrast image (right)
- Whole-well fluorescence images of the 6-well plate (below)
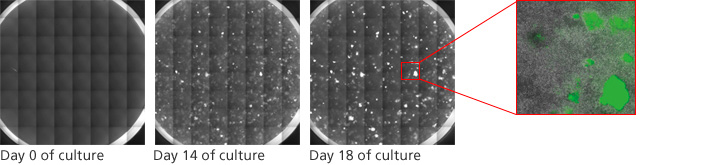
Courtesy of Associated Professor Noriyuki Tsumaki, Department of Bone and Cartilage Biology, Osaka University Graduate School of Medicine
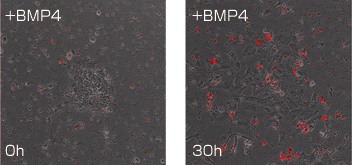
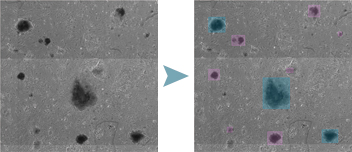
Apoptosis
The apoptosis process of human ES cell line H9 cultured in the presence of MEF-CM on Matrigel® was observed. Annexin V (red fluorescence) was used as a detection probe for the cell membrane change that was caused by added BMP4.
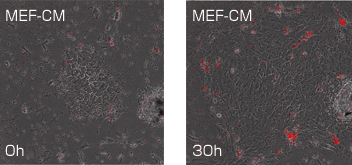
Courtesy of Mr. Jamie McNicol, McMaster University
iPS/non-iPS cell colony auto identification and colony counting
Image analysis software CL-Quant (optional)
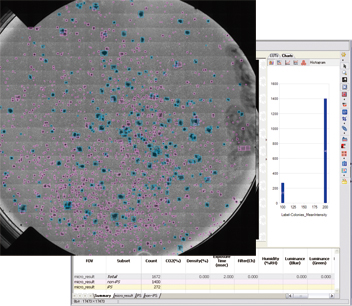
GFP: Nanog-GFP
DsRed: retrovirally transduced
Vessel: 100-mm culture dish
Magnification: 2x
Culture period: 3 weeks
Imaging interval: 4 hours
Courtesy of Dr. Hidemasa Kato, Saitama Medical University
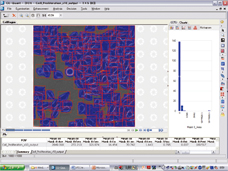
Reprogramming process of mouse iPS cells
iPS cell colonies (blue) and non-iPS cell colonies (pink) are automatically distinguished based on expression/non-expression of Nanog-GFP, a marker for undifferentiated cells, and the colony information from a phase contrast image.
Cancer and other researches
Image analysis software CL-Quant (optional)
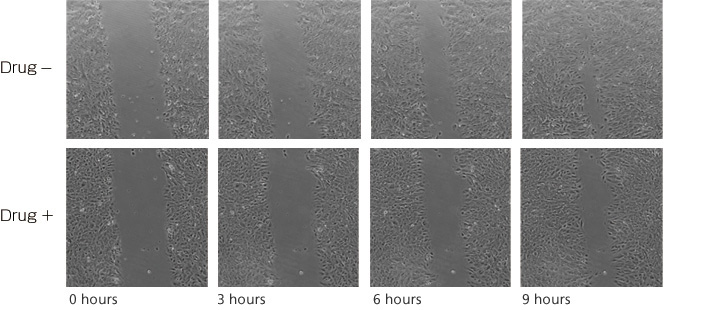
Scratch assay
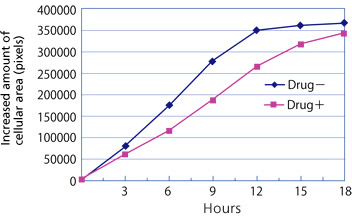
The acellular areas are extracted from captured images, and the time course is quantified. This enables comparative analysis of cells' metastatic ability.
Inhibition of cell migration by the anti-cancer drug sunitinib (Sutent®) added to clear cell renal carcinoma cell line (KMRC-1) was quantified by scratch assay.
Cellular areas in the images captured in three-hour-interval time-lapse observation by BioStation CT were quantified by image analysis software CL-Quant.
Courtesy of Dr. Naohisa Tomosugi and Dr. Shintaro Maru, Division of Nephrology, Kanazawa Medical University
Cell counting
Cell counting is possible with phase contrast images.
Alkaline phosphatase (AP)-positive colony counting
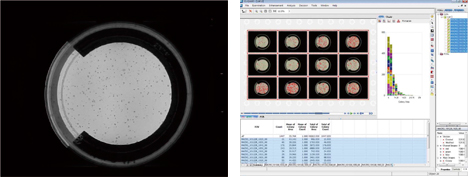
AP-positive colony area comparison in 12 100-mm culture dishes
Courtesy of Dr. Kazutoshi Takahashi and Mr. Koji Tanabe, Department of Reprogramming Science, Center for iPS Cell Research and Application (CiRA), Kyoto University
BioStation CT offers alkaline phosphatase-positive colony counting in macro images captured after AP staining, which enables valuation of the undifferentiated stem cell state.
-
-
Nikon will exhibit at the ISSCR 11th Annual Meeting. BioStation CT will be on display.
-
 Stem Cell Research – Nikon BioStation CT