Segment Information
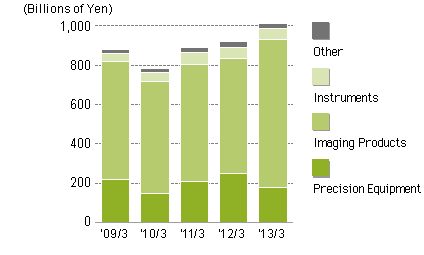
Net Sales by Industry Segment

(Millions of Yen)
| Fiscal Year-End | 2009/3 | 2010/3 | 2011/3 | 2012/3 | 2013/3 |
|---|---|---|---|---|---|
| Net Sales | 879,719 | 785,498 | 887,512 | 918,651 | 1,010,493 |
| Net Sales by Industry Segment * | |||||
| Precision Equipment | 219,915 | 150,100 | 208,613 | 248,145 | 179,013 |
| Imaging Products | 596,468 | 569,464 | 596,375 | 587,127 | 751,240 |
| Instruments | 44,642 | 45,051 | 57,451 | 56,000 | 53,877 |
| Other | 18,693 | 20,881 | 25,071 | 27,379 | 26,363 |
- *Net sales by industry segment comprise sales for outside customers
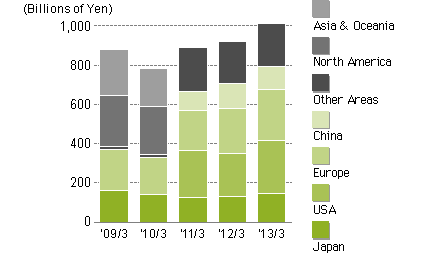
Net Sales in Japan and Export Sales by Region

(Millions of Yen)
| Fiscal Year-End | 2009/3 | 2010/3 | 2011/3 | 2012/3 | 2013/3 |
|---|---|---|---|---|---|
| Net Sales in Japan and Export Sales by Region*1 | |||||
| Japan | 163,682 | 139,026 | 127,162 | 130,517 | 144,417 |
| Overseas | 716,037 | 646,472 | 760,350 | 788,134 | 866,075 |
| USA | ― | ― | 237,611 | 221,768 | 271,459 |
| Europe | 208,957 | 189,507 | 202,854 | 225,739 | 260,038 |
| China | ― | ― | 96,956 | 126,302 | 118,162 |
| Other Areas | 13,677 | 16,223 | 222,927 | 214,325 | 216,416 |
| North America | 261,368 | 245,112 | ― | ― | ― |
| Asia & Oceania*2 | 232,034 | 195,629 | ― | ― | ― |
- *1From the year ended March 2011, "North America" and "Asia" area has been changed to "Other Areas".
- *2From the year ended March 2008 to the year ended March 2010, "Asia" area had been changed to "Asia & Oceania" area.
