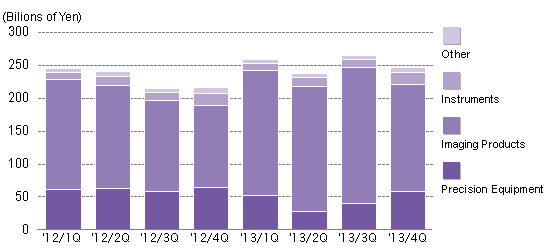
Financial Results by Quarter
Financial Results by Quarter

(billions of Yen)
| Fiscal Year-End | 2012/3 | 2013/3 | ||||||
|---|---|---|---|---|---|---|---|---|
| 1Q | 2Q | 3Q | 4Q | 1Q | 2Q | 3Q | 4Q | |
| Net Sales | 245.6 | 240.7 | 215.4 | 217.0 | 259.4 | 237.8 | 266.0 | 247.2 |
| Net Sales by Industry Segment | ||||||||
| Precision Equipment | 61.7 | 63.1 | 58.9 | 64.4 | 52.2 | 28.2 | 39.7 | 58.8 |
| Imaging Products | 167.0 | 157.5 | 137.5 | 125.1 | 190.1 | 190.9 | 207.3 | 162.8 |
| Instruments | 11.1 | 13.5 | 13.3 | 18.1 | 10.8 | 12.9 | 12.1 | 17.9 |
| Other | 5.7 | 6.6 | 5.8 | 9.3 | 6.1 | 5.9 | 6.8 | 7.5 |
| Operating Income | 36.9 | 24.3 | 8.2 | 10.7 | 23.3 | 13.8 | 2.1 | 11.7 |
| Ordinary Income | 37.8 | 27.4 | 11.0 | 13.2 | 23.4 | 16.1 | 1.4 | 7.3 |
| Net Income | 30.7 | 19.7 | -3.7 | 12.6 | 15.7 | 16.3 | 0.3 | 10.1 |
- <Note> Fiscal 2011 and 2012, rounded to 0.1 billion Yen. From fiscal 2013, rounded down to 0.1 billion Yen.
- Business Performance
- Segment Information
- Asset Status
- Other Performance Indicators
- Financial Results by Quarter
- Financial Statements
- Financial Data Summary
