Business Performance
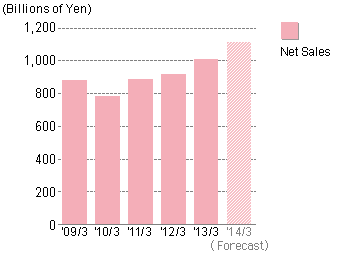
Net Sales

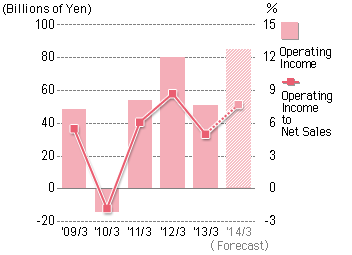
Operating Income/
Operating Income to Net Sales
Operating Income to Net Sales

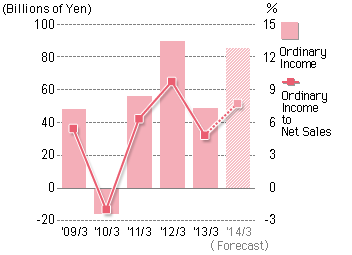
Ordinary Income/
Ordinaly Income to Net Sales
Ordinaly Income to Net Sales

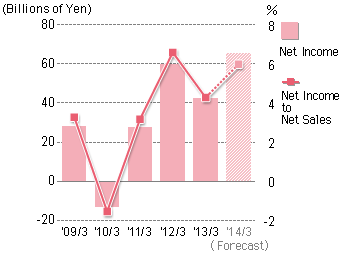
Net Income/
Net Income to Net Sales
Net Income to Net Sales

(Millions of Yen)
| Fiscal Year-End | 2009/3 | 2010/3 | 2011/3 | 2012/3 | 2013/3 | *2014/3 (Forecast) |
|---|---|---|---|---|---|---|
| Net Sales | 879,719 | 785,498 | 887,512 | 918,651 | 1,010,493 | 1,110,000 |
| Operating Income | 48,184 | -13,854 | 54,052 | 80,080 | 51,001 | 85,000 |
| Operating Income to Net Sales | 5.5% | -1.8% | 6.1% | 8.7% | 5.0% | 7.7% |
| Ordinary Income | 47,689 | -15,334 | 55,811 | 89,383 | 48,344 | 85,000 |
| Ordinary Income to Net Sales | 5.4% | -2.0% | 6.3% | 9.7% | 4.8% | 7.7% |
| Net Income | 28,055 | -12,615 | 27,312 | 59,305 | 42,459 | 65,000 |
| Net Income to Net Sales | 3.2% | -1.6% | 3.1% | 6.5% | 4.2% | 5.9% |
- *Forecasts for the year ending March 2014 (as of May 9, 2013)
