Other Performance Indicators
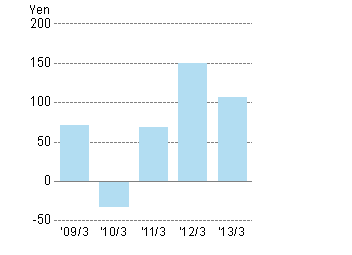
Net Income per Share
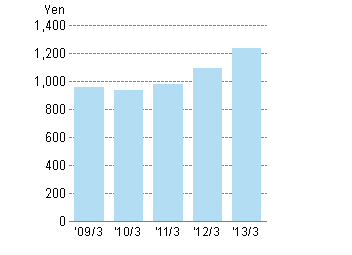
Net Assets per Share
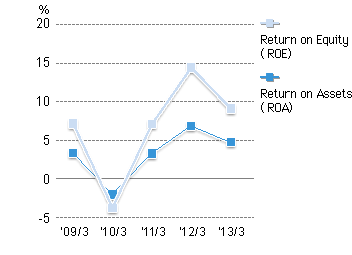
Return on Equity (ROE)/
Return on Assets (ROA)
Return on Assets (ROA)
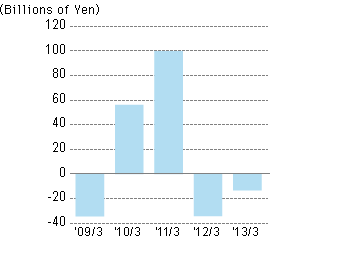
Free Cash Flows
(Millions of Yen Unless Indicated)
| Fiscal Year-End | 2009/3 | 2010/3 | 2011/3 | 2012/3 | 2013/3 |
|---|---|---|---|---|---|
| Net Income per Share (Yen) | 70.76 | -31.82 | 68.90 | 149.57 | 107.07 |
| Net Assets per Share (Yen) | 955.72 | 937.75 | 980.62 | 1,091.98 | 1,236.84 |
| Return on Equity (ROE) | 7.3% | -3.4% | 7.2% | 14.4% | 9.2% |
| Return on Assets (ROA) | 3.6% | -1.7% | 3.5% | 7.0% | 4.9% |
| Free Cash Flows * | -34,406 | 56,390 | 100,024 | -34,071 | -13,219 |
- *Net cash provided by operating activities + Net cash provided by investing
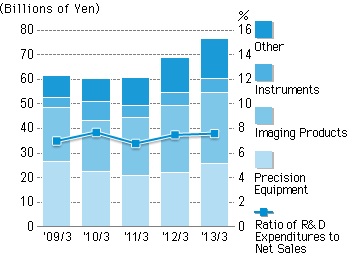
R&D Expenditures by Industry
Segment / Ratio of R&D
Expenditures to Net Sales
Segment / Ratio of R&D
Expenditures to Net Sales
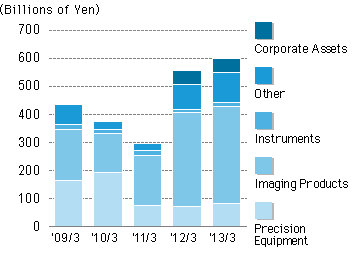
Capital Expenditures
by Industry Segment
by Industry Segment
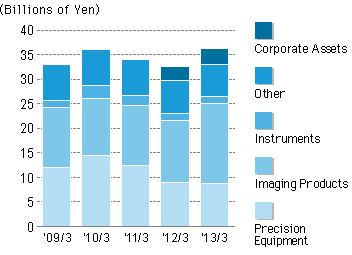
Depreciation and Amortization
by Industry Segment
by Industry Segment
(Millions of Yen Unless Indicated)
| Fiscal Year-End | 2009/3 | 2010/3 | 2011/3 | 2012/3 | 2013/3 |
|---|---|---|---|---|---|
| R&D Expenditures | 61,489 | 60,260 | 60,767 | 68,701 | 76,496 |
| R&D Expenditures by Industry Segment | |||||
| Precision Equipment | 26,605 | 22,349 | 20,837 | 22,252 | 25,744 |
| Imaging Products | 21,902 | 20,981 | 23,814 | 27,058 | 29,063 |
| Instruments | 3,934 | 7,450 | 4,511 | 5,315 | 5,519 |
| Other | 9,047 | 9,482 | 11,607 | 14,075 | 16,169 |
| R&D Expenditures to Net Sales | 7.0% | 7.7% | 6.8% | 7.5% | 7.6% |
| Capital Expenditures * | 43,467 | 37,525 | 29,776 | 55,914 | 60,158 |
| Capital Expenditures by Industry Segment | |||||
| Precision Equipment | 16,622 | 19,313 | 7,596 | 7,341 | 8,301 |
| Imaging Products | 18,255 | 13,908 | 17,951 | 33,298 | 34,449 |
| Instruments | 1,640 | 1,439 | 1,599 | 1,233 | 1,512 |
| Other | 6,951 | 2,864 | 2,628 | 9,058 | 10,733 |
| Corporate Assets | ― | ― | ― | 4,982 | 5,161 |
| Depreciation and Amortization * | 32,910 | 35,955 | 34,033 | 32,570 | 36,225 |
| Depreciation and Amortization by Industry Segment | |||||
| Precision Equipment | 11,992 | 14,563 | 12,524 | 9,024 | 8,720 |
| Imaging Products | 12,248 | 11,543 | 12,198 | 12,585 | 16,258 |
| Instruments | 1,482 | 2,553 | 2,045 | 1,476 | 1,550 |
| Other | 7,188 | 7,296 | 7,265 | 6,586 | 6,454 |
| Corporate Assets | ― | ― | ― | 2,897 | 3,241 |
- *Investments in or depreciation of property, plant and equipment and intangible fixed assets.
- Business Performance
- Segment Information
- Asset Status
- Other Performance Indicators
- Financial Results by Quarter
- Financial Statements
- Financial Data Summary
